Distribution by country
( Standard IQ Test )
Statistics for IQ Haven Tests


Sample IQ Report
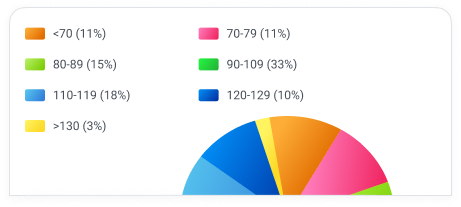
IQ Score Statistics per Test
IQ testing measures your crystallized and fluid intelligence, forming your general intelligence when seen as a whole. Crystallized intelligence is defined as intelligence which has been amassed from past learning and experiences. It is intelligence which supplies us with knowledge and understanding rooted in facts derived from physical encounters. The more crystallized experience we have the better we are at comprehending what we read and learn from academic sources. Fluid intelligence refers to our ability to apply acquired information and knowledge to rational problem solving and reasoning. It is a measure of our perceptual capabilities, showing our overall capacity to reason, adapt and learn new things independent of facts other forms of crystallized intelligence.
IQ Score Statistics per Time
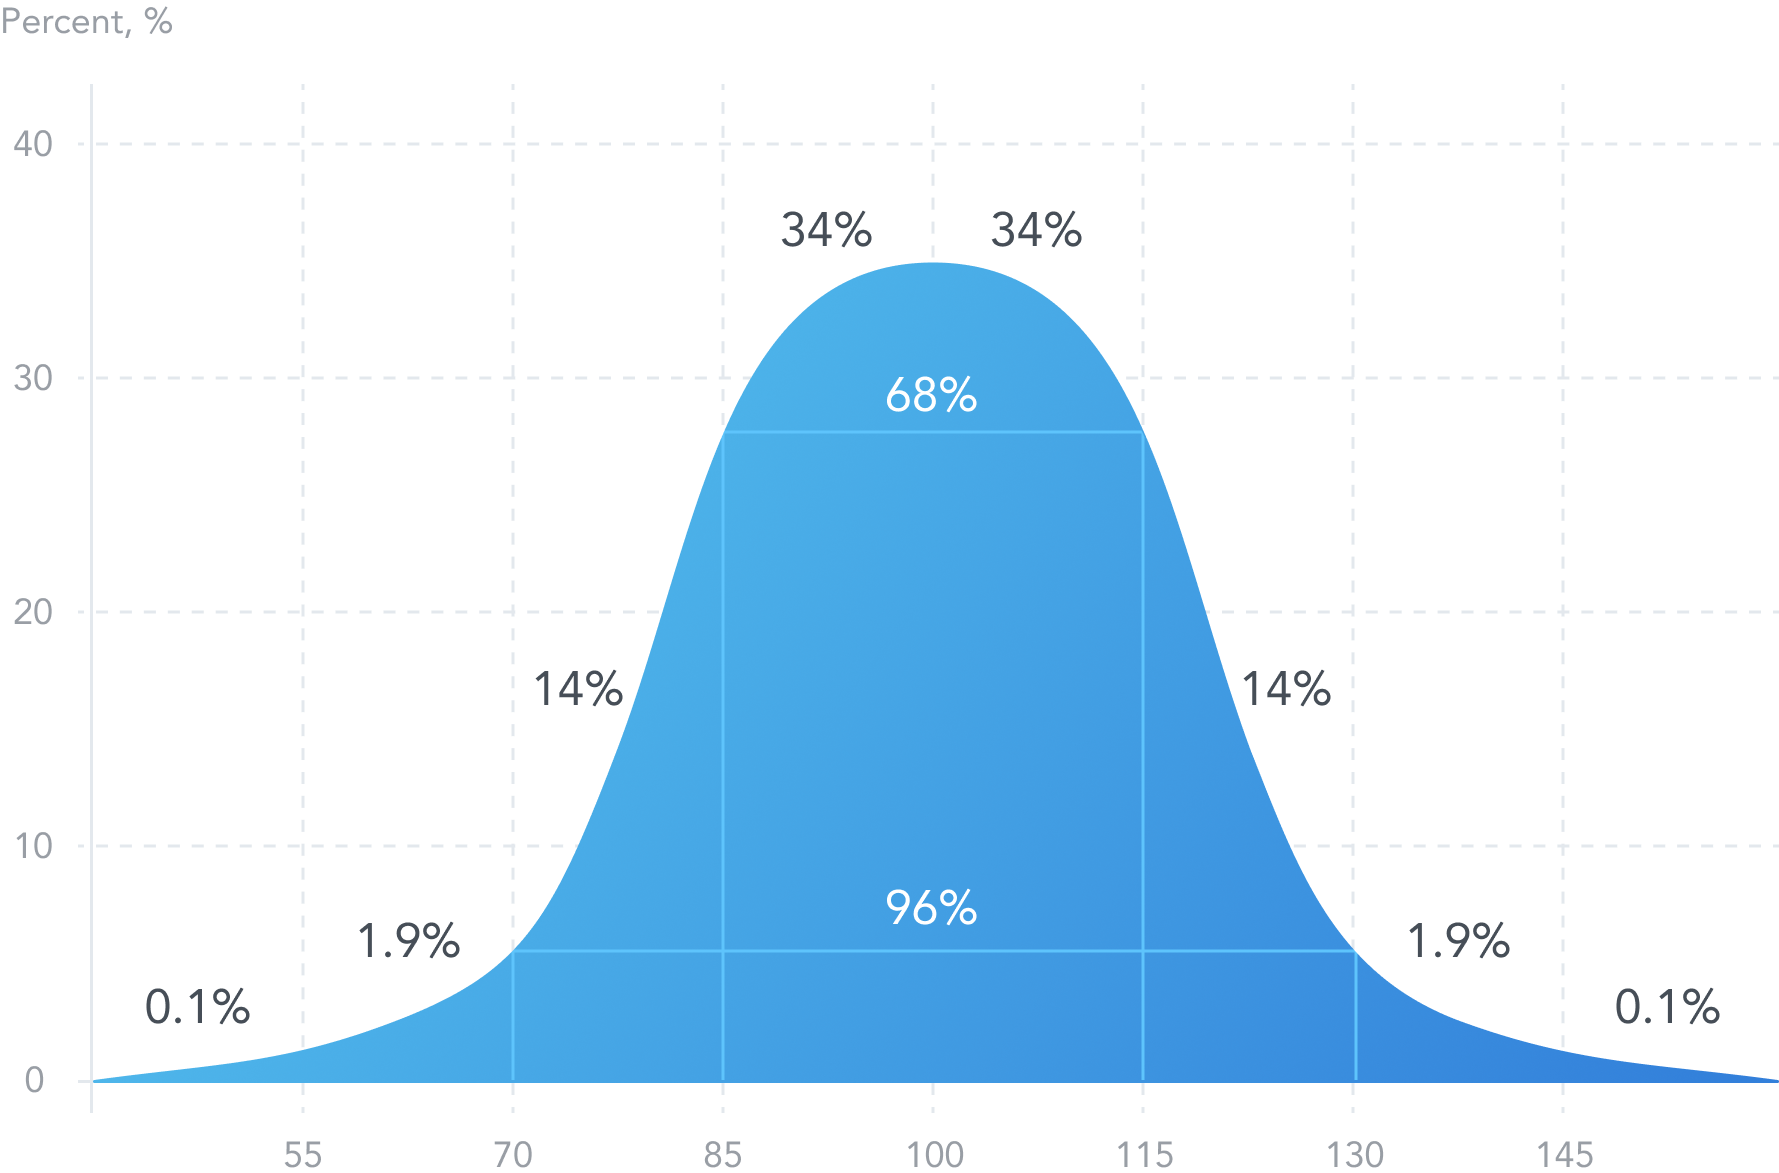
IQ tests are extremely accurate despite outside factors such as extreme stress and predisposed thoughts having a slight effect. There is also a slight variation between scores relative to age, with younger test subjects having the higher volatility and degree for error. Essentially all IQ scores are not an exact measure but rather give you a relative range. Different IQ tests all target different evaluations which is why your IQ score rather distinguishes between the scope of your intelligence on average. The Wechsler Intelligence Scale is designed to have a mean of 100 allowing a standard deviation of 15 with the scores forming a bell curve when graphed. As you can see, at just a 15 point spread there is little margin for error.

Latest 15 results
- Taha Ahmed
- Egypt IQ: 99
- 3453456
- United States IQ: 70
- Wout
- Belgium IQ: 110
- Hassan
- United States IQ: 96
- Karib
- Bangladesh IQ: 101
- Vikena
- Albania IQ: 95
- Mustafa Nadeem
- United States IQ: 79
- 453453
- United States IQ: 70
- Maximilian Hooper
- United States IQ: 105
- C
- United States IQ: 111
- Lucas
- Germany IQ: 109
- ук35252
- United States IQ: 70
- Teodor
- Romania IQ: 103
- е456464356
- United States IQ: 118
- Ritesh Mourya
- India IQ: 99